Category: Knowledge

  • Top Metrics for VCs to Monitor their Investments

    Top Metrics for VCs to Monitor their Investments

    After weeks or months of meeting, conducting due diligence, you have finally made an investment in a venture. However, now you can’t sit back and relax as the investment monitoring phase begins. One of the key success factors for a successful exit is to effectively monitor the progress of your portfolio companies. And choosing the right metrics for VCs monitoring is the key.

    There are numerous metrics which can help you in monitoring process but it is essential to select the relevant ones. However, the relevant metrics for SaaS (Software-as-a-Service) companies won’t be the same as for the pharmaceutical company. Hence, our goal here is to depict which metrics are important for particular industries and how you can effectively track them with software venture capital tools. 

    VCs metrics for Marketplace Startups

    For marketing place startups, one of the main metrics is the Gross Merchandise Value (GMV). It indicates the gross value of transacted goods and is calculated by the formula below:

    GMV = Average value of an order x Number of transactions 

    However, one of the caveats associated with GMV is that it doesn’t take into consideration the value of discounts, returns, cancellations. Furthermore, it is not an indicator of revenue.

    This can easily be seen in the chart example below which depicts the GMV of Alibaba from FY 2014-FY 2019 . In FY 2019 it was approximately CNY 5727 billion, while at the same time the revenue for entire Alibaba group stood at CNY 376.8 billion


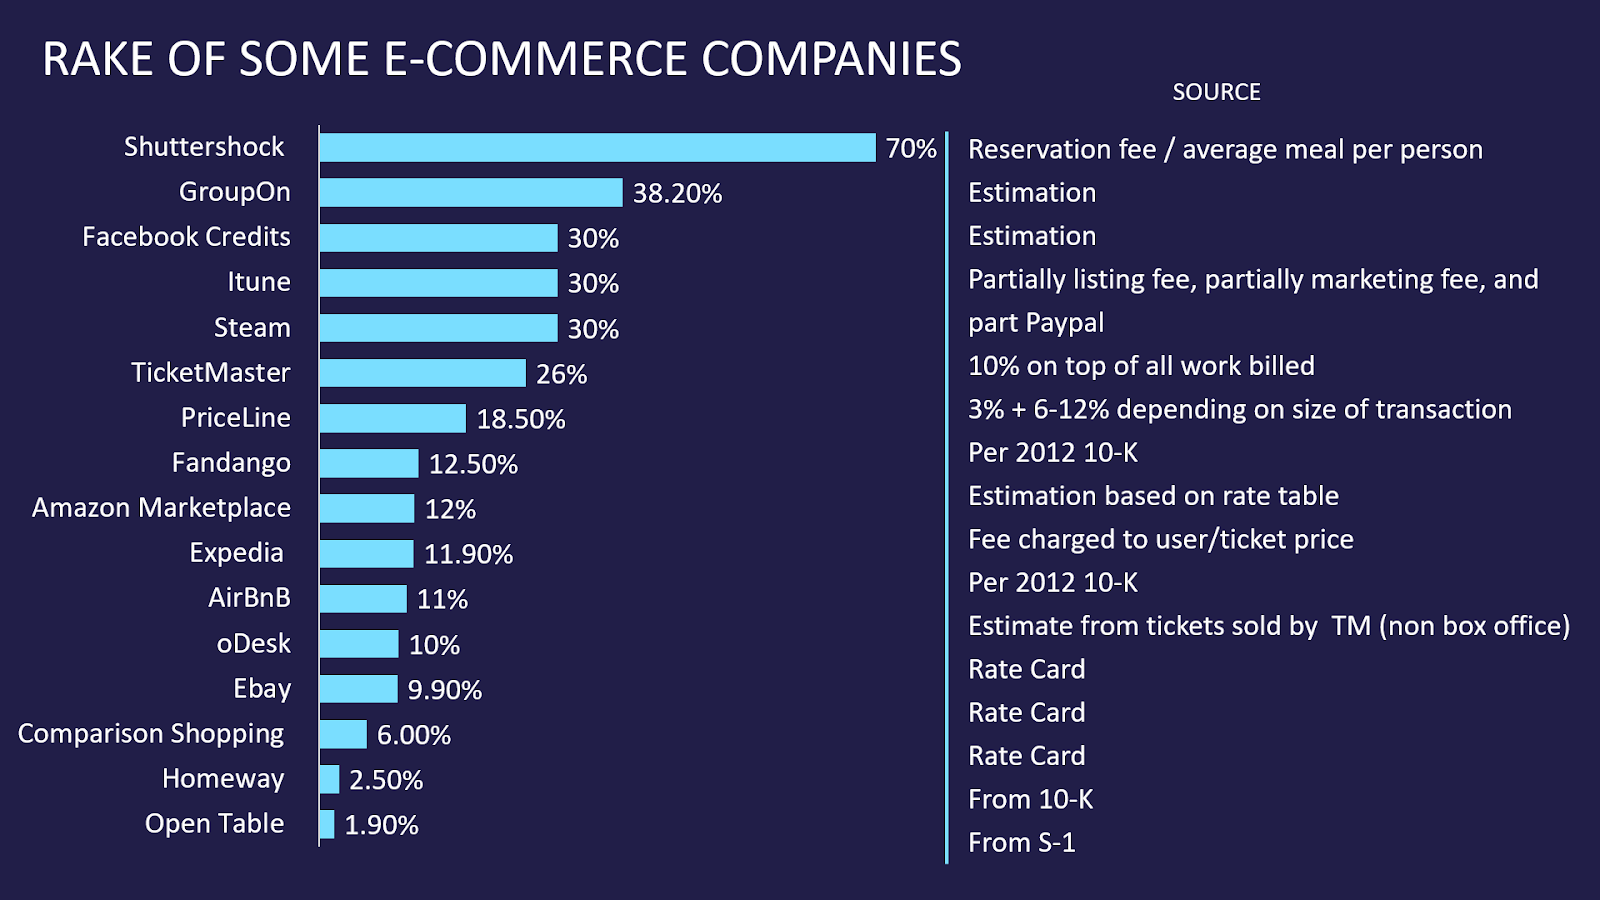
    Take rate or Rake- refers to the percentage of sales and commission a company earns on its sales. For instance, Airbnb charges 3% from the hosts and a variable service fee from the guests which is somewhere around 11% but it decreases as the cost of booking goes up. Similarly this metric is important for payment processing companies as well. 

    The figure below shows the rake of some major e-commerce marketplaces:

    SaaS Companies (B2B) 

    Product market fit

    The first step to measuring performance of a B2B SaaS company is to assess the product market fit. This can be done by looking at the Annual Recurring Revenue or ARR and the cash burn rate. If a SaaS startup doesn’t have a product market fit then it will be burning more cash than its ARR. In such cases, the company is spending too much on acquiring new customers who are in turn leaving the product. As a result, the ARR is low. In a nutshell, the lack of product market fit is an indicator of unsustainable growth prospects.

    ARR Calculation

    In the most simple way, ARR = Monthly Recurring Revenue (MRR) x 12

    However, the customer must sign up for a yearly subscription contract. Below I am mentioning some more cases to calculate ARR:

    Annual Recurring Revenue as VCs Metrics example

    Growth prospects

    After looking at product market fit, the next avenue to evaluate is the growth prospects. Typically for B2B  SaaS companies, one of the growth benchmarks is T2D3 which translates to Triple, Triple, Double, Double, Double. This means that SaaS companies in Series A-B phase must show at least 3x growth year over year for three consecutive years and then show at least 2x growth.  

    The figure below shows T2D3 path of some prominent SaaS companies:

    Source: Battery Ventures

    Sales efficiency VCs metrics

    One of the most popular VCs metrics for measuring sales efficiency of SaaS companies is the CAC (Customer-Acquisition-Cost) payback period. It shows the amount of time it takes a company to recover the cost it paid to acquire a customer. 

    VCs Metrics for SaaS Companies (B2C) 

    For SaaS B2C companies, the top metrics to look at are: Customer Chrun Rate, Revenue Chrun Rate, Customer Lifetime Value and Leads to Customer rate.

    To start with, the Customer Churn Rate measures the number of customers a company has lost over a specified period of time.  

    Furthermore it is very important to calculate the Revenue Churn Rate because different customers can have different revenue weight-age. For example, losing five customers who pay $5000/year is less disastrous than losing a single customer that pays $45,000/year. 

    In addition, the Customer Lifetime Value denotes the average amount of money a customer pays during the whole engagement period with your company. It is calculated by finding the customer lifetime rate followed by average revenue per account. 

    Finally, the Leads to Customer Rate depicts the percentage of leads that were converted to customers.

    VCs Metrics for Pharmaceutical Startups

    As aforementioned, different industries will require different metrics for performance assessment. Hence, here we will discuss the relevant VCs Metrics for the pharmaceutical industry. 

    In order to show a strong standing the company must have a large number of discovered molecules and a significant number undergoing clinical trials.

    Furthermore, an extremely important metrics is the R&D Spending. This metric is calculated by looking at the total amount of funds spent on R&D initiatives and comparing it to the amount spent on completing the development of products in the end cycle. Therefore, a small R&D spending is an indicator of lack of innovation and reluctance to adopt new technology. 

    In addition, Investment to IP ratio will depict how successfully the company is utilizing its R&D efforts to get more Intellectual Property (IP). The higher the number of IPs the better.

    Moreover, the number of partnerships with other pharma companies is yet another sign of growth and credibility.

    Finally, the Team Structure, or the number of specialists in each section is a very important indicator. Typically the team should have the following structure: 33% biochemistry specialists, 33% AI specialists, 33% investor relations and business development. As a best practice, the number of biochemistry specialists should not be less than 10.    

    How to track all these metrics?

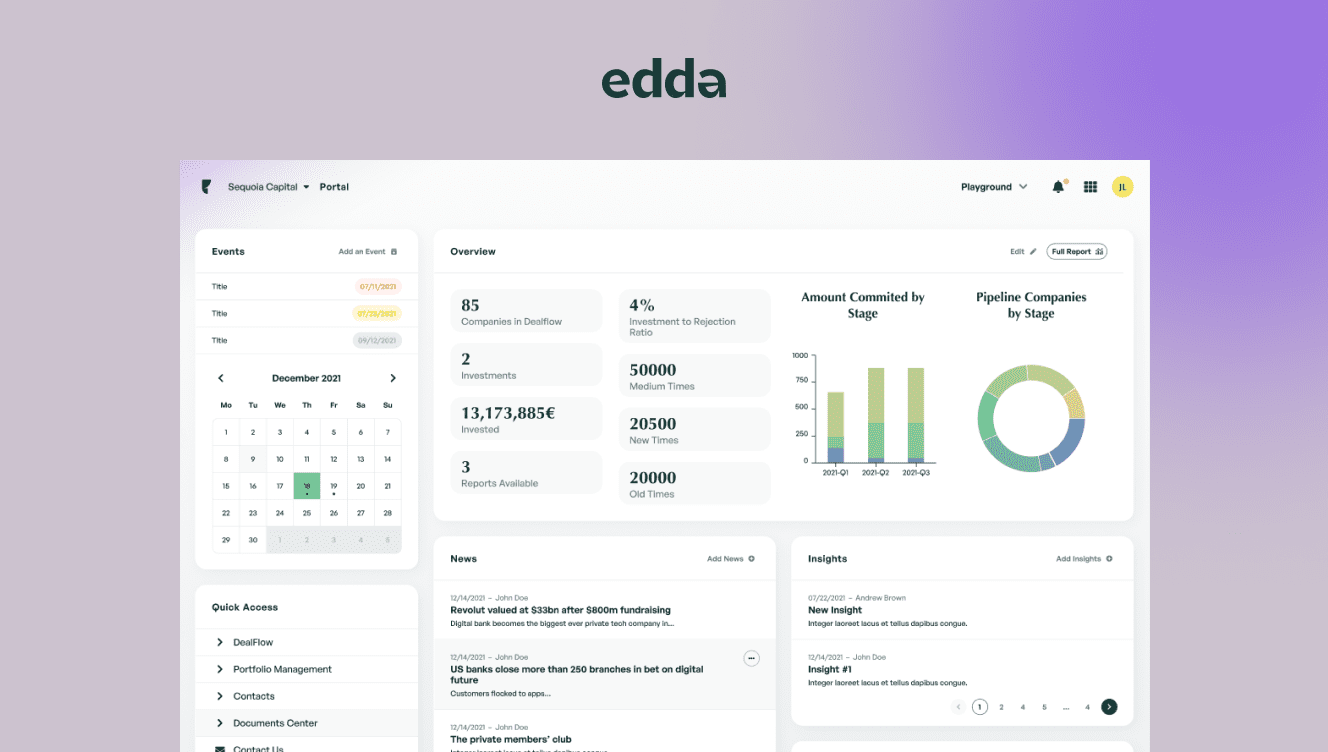
    Evidently, there are countless metrics for tracking the performance of the portfolio companies. However, the burning question here is, how do you keep track of all the relevant metrics? And the answer is the Edda Management Suite which fetches you the most user friendly solution. 

    Clean, Precise and User Friendly

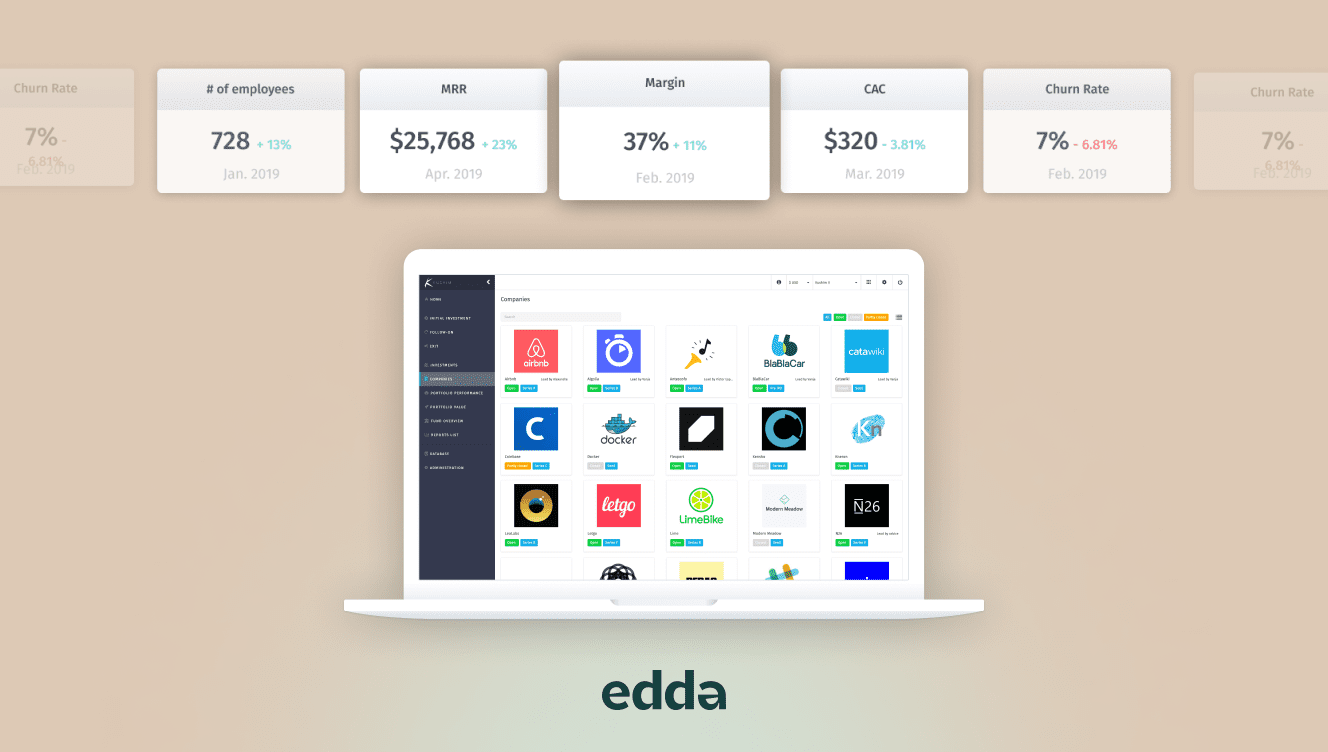
    The “Companies” section of Edda’s Management Suite illustrates all companies in your portfolio in a precise and user friendly way. It also provides a quick search option. 


    One size CAN fit all

    With a click you can open the company page which contains its details along with the section for captable and metrics. By default you have 60 different metrics which are well organized and categorized. Some of the categories include: Financial performance, HR, Market, Marketing, Operational Performance and Company.

    You can select the metrics which are relevant to you and also create new metrics. 
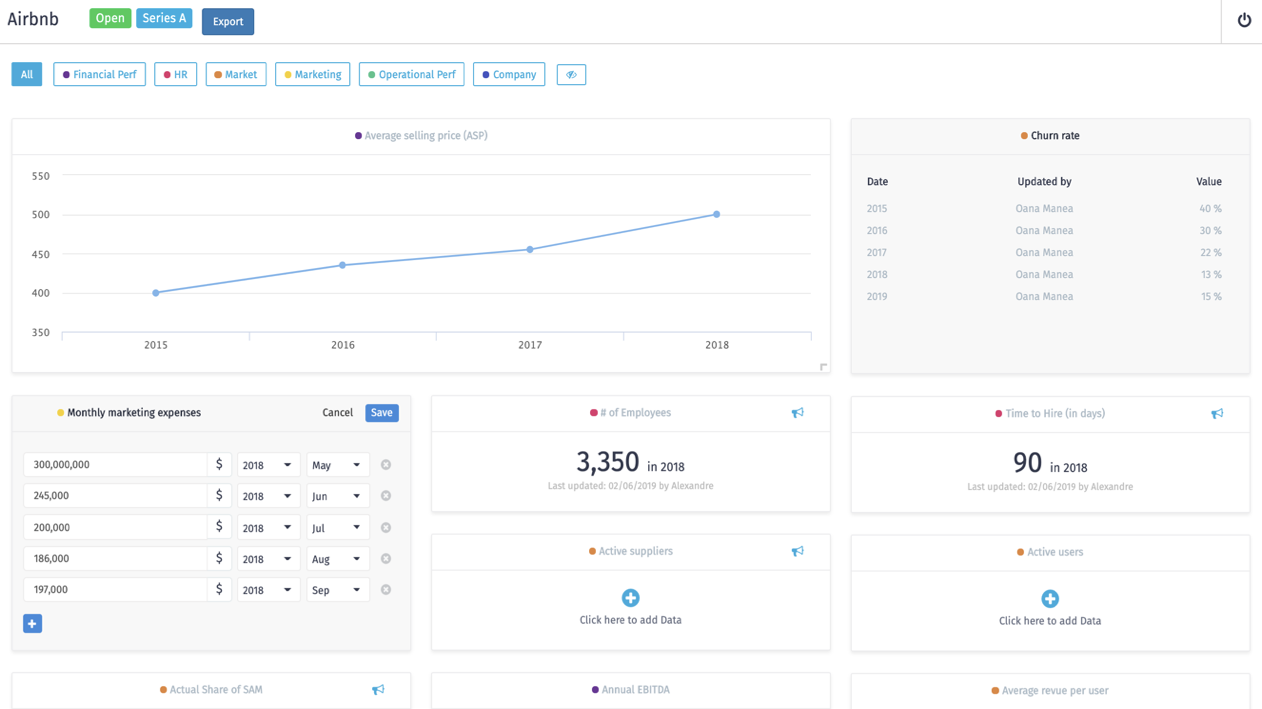

    Stay Updated 

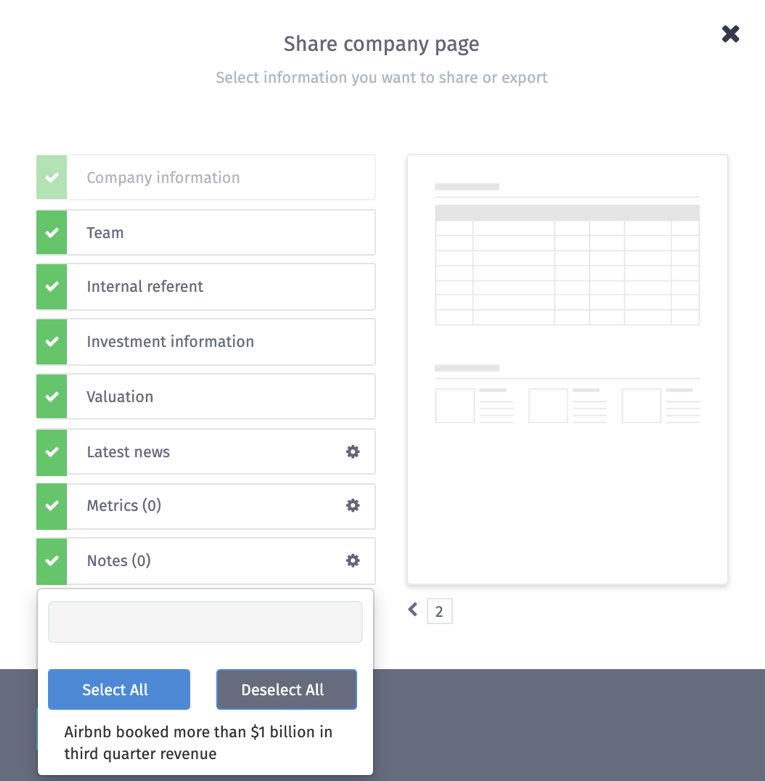
    With venture capital management software you can grant access to your portfolio company’s page for the officials of that particular company. In addition, with one click you can send an email to the company representatives to ask them to metrics updates. You can also export company details including the metrics to PDF using the Export button.

    Finally, besides the metrics, the Edda Management Suite can do a lot more of the heavy lifting for you. Want to know how it can help you measure the performance of your entire fund or funds? 


    That’s all for this post! If you are interested, we have compiled a list of 200+ metrics for SaaS, Pharmaceutical, Social Impact, Real Estate and many more industries.

    Click here to learn more about measuring the performance of your fund and contact us for a demo of Edda’s venture capital portfolio management software.

  • Measuring The Performance of a VC Fund

    Measuring The Performance of a VC Fund

    When we say VC fund performance, the first metric that comes up is the Internal Rate of Return or IRR. Indeed, investors typically compare the fund performance with the aggregate returns generated by an entire VC asset class. For instance, let’s say that a specific fund of a certain vintage year generated 34.5% IRR then an investor would use this to compare with appropriate benchmarks. 

    However, in this process, there are some caveats- 

    1. The Vintage Year Temptation
      Sometimes fund managers are tempted to assign vintage year when he started raising the fund not when the final close happened. 
    2. The Categorisation Issue
      There is a gigantic gamut of universes to compare. Of course, it is a good practice to position your fund in an appropriate category to avoid comparing apples with oranges. For instance, the appropriate categories can be:
      a) All Early stage VC funds or Technology VC funds or
      b) All French early stage technology VC funds
    3. The Peril of Unrealized Returns
      It is a good practice to not include unrealized returns in calculating fund performance as unrealized returns are risky since value of shares held in a private company can often exhibit large deviation. 
    4. The Precision of data
      In general, VC industry has the self-reporting culture and often LPs have opinionated that mostly the mediocre managers report data. 

    DRAWBACKS OF IRR     

    According to an informal research done by McKinsey in 2004, only 20% of executives understood the critical drawbacks of IRR. For instance, if you compare two funds, one with an IRR of 24% with that of 11%, one would be inclined to regard the first fund as better performing. However, the devil here is again in the details. This is due to the fact that the IRR is not telling us the reinvestment risks and capital redeployment in other investment opportunities. 

    IRR in measuring VC fund performance is not enough

    Next, the IRR is a percentage and so there is a case where a small investment can show a big double digit or a triple digit IRR while a large investment can show an IRR of single digit but be more lucrative once it is accounted for the net present value (NPV). 

    OTHER VC FUND PERFORMANCE METRICS

    Besides IRR, some LPs are also using metrics such as COC, TVPI or DPI to measure the performance of a VC fund. using metrics such as.

    Cash-On-Cash return (COC)
    In VC and PE landscape, COC multiple shows how much return the fund received after exiting the investments. Of course, the investors will always prefer an investment with 40% IRR over a 5 year period with 4x COC over an investment with 100% IRR over a 1 year period with 2x COC. The COC multiple of an entire fund helps the LPs know how much carried interest will be available to split. 

    To explain the next multiples, we will first introduce some terminology which is used to calculate the multiples listed below: 

    Paid in Capital
    This refers to the capital contributed by the LPs to a fund. It is also known as “Contributed Capital”. 

    Distribution
    This is the value of cash stocks that is given back or distributed by the fund to the LPs. 

    Residual Value
    It is the remaining value of a fund at a given point in time. It is calculated by adding fair value of all remaining investments plus any cash equivalents minus any liabilities. 

    Total Value (TV)
    The total value of a fund is the sum of Residual Value and Distribution.

    TV = Distribution + Residual Value

    The figure below shows an illustration of the terminology discussed above.

    Now let’s have a look at different multiples

    Distributions to Paid-in Capital (DPI)
    It is calculated by dividing distributions by paid-in capital. 

    A DPI of 5x means the fund provided a return to LPs that was 5 times the paid-in capital. Therefore, LPs desire a higher DPI multiple. 

    Residual Value to Paid-in Capital (RVPI)
    It is calculated by dividing residual value by paid-in capital.

    Total Value Paid-in Capital (TVPI)
    It is calculated by dividing the Total Value by Paid-in Capital.

    Since Total Value = Distribution + Residual Value 

    Hence, TVPI = DPI + RVPI

    ENTER THE PUBLIC MARKET EQUIVALENT (PME)

    Besides IRR, the other multiples discussed above serve as a good metric to measure the performance of a fund. However, there is another measure called Public Market Equivalent which basically measures the performance of a fund compared to a public market index such as S&P 500. A fund having a PME of more than 1 indicates that the LPs received better return by investing in the fund rather than investing in the market. 

    Let’s say an LP invested $100 million in a fund and received $500 million after 5 years. In the same time frame, had the investor invested in S&P 500, he would have earned $395 million.  So the gross PME = 500/395 = 1.26. In this case, the investor didn’t lose money by investing in VC fund as the PME is greater than one. 

    What I have described above is a simple way to calculate PME, there are different forms of PME which have been developed over the years such as LN PME, KS PME, mPME, PME+ and Direct Alpha. 

    THE KUSHIM WAY OF MEASURING VC FUND PERFORMANCE

    The venture capital portfolio management software of Kushim offers customization and user friendly interface to continually monitor the VC fund performance.


    All Fund Performance Multiples

    The fund performance section offers all the information about your fund’s performance and all the multiples mentioned above are calculated as well.


    You want metrics? Here they are!

    Kushim’s venture capital management software offers 60 in built metrics to measure the performance of your portfolio companies. In addition, keeping in mind the bespoke nature of our solutions, now you can add your custom metrics. Moreover, you can even send an email directly from Kushim Management suite to your portfolio company and invite them to update the metrics. 

    The representative of your portfolio company will only be able to access the company page of his/her company and update the metrics.


    Reporting simplified 

    The software venture capital tool offers dynamic data about your portfolio’s performance that can be exported to Excel with a single click.


    The report generation tool

    For those who love analytics and want to create custom reports, the Kushim venture capital software features a report generation tool that is dynamic in nature. All you need to do is select the type of data you want to compare and create dynamic reports that can be downloaded any time.


    These are some of the salient features of Kushim’s venture capital software. If you would like to know more click on the below button to book a demo. 

    Finally, in this article we have presented some of the basic metrics for measuring the performance of a VC. If you would like to read more on advanced methods for measuring a fund’s performance click here.

    Source

    John C. Kelleher and Justin J. MacCormack, “Internal Rate of Return: A Cautionary Tale,” McKinsey Quarterly, October 20, 2004.

    The Business of Venture Capital by Mahendra Ramsinghani

  • Benefits of Venture Capital Firm Networks

    Benefits of Venture Capital Firm Networks

    At some point, we have all heard about the saying: “Networking is the key to success”. In this article, we will talk about Venture Capital firm networks for and their benefits.

    The VC landscape is full of networks, however the best and most common example of a VC firm network is syndication. Syndication refers to a situation where two or more venture capital firms join forces to make the complete investment for a particular round. In this arrangement, one of them is taking the role of the leader.

    In many cases, syndication occurs even when a the funding requirements are modest. This is exactly one of the questions we will address here through providing some empirical evidence. We will talk about the findings of one study which focuses on the Canadian VC industry. In addition we will also discuss another study which focuses on the UK and European VC market.

    The Canadian study was conducted by researchers from the University of Pennsylvania and University of British Columbia. While the European study was conducted by researchers from the London School of Economics and University of South Hampton.  

    The Canadian Study

    The Canadian study set forth to test two theories associated with networking effect. The first theory is the selection theory which basically means that VCs want a second opinion from other VCs before making a decision. The second theory is the value-addition theory which means that VCs go for syndication because it is more beneficial.

    Empirically, if syndication is done for selection then the exit return on syndicated investments should be lower than standalone investments. Alternatively, if syndication is done for value-addition then syndicated investments should have higher exit return than standalone investments. The sample size consisted of divestitures of VCs from 1992 till first quarter of 1998.

    The total observation set consisted of 584 exits but only 393 were considered as annualized returns couldn’t be calculated for the remaining 171 exits. The study defined syndication as “narrow” and “broad”. A narrow syndication was defined as a situation where, let’s say investor A invests and exits and investor B invests. All this happens in a year. In broad syndication the time period is taken as 6 years. Of the 393 exits there were 147 narrow syndications and 194 broad syndications.

    After talking too much about the data, let’s look at the results. The findings indicated that syndicated investments had on average higher return than standalone investments. This finding affirmed the value-addition theory i.e. VCs seek syndication to add more value to their portfolio companies. However, the study also stated that the selection-theory effect is not completely absent. So, there are some instances where VCs seek syndication for second opinion.

    The European Study

    Now let’s move on to a more recent study involving VCs in United Kingdom and Continental Europe. In the Canadian study we saw that syndication offers better returns than standalone investments. The European study goes deeper to see what happens when syndications are coupled with more relationship-building efforts. The study consisted of 624 VCs and examination period was 1995-2005.

    Firstly, the study investigated the effect of GP’s networking with other investors while they sit on the board of portfolio companies, on the fund’s performance. This benchmark analysis yielded that GP’s with more experience and stronger network improves a fund’s performance.

    Secondly and lastly, the study wanted to test the extent to which networking benefits fund performance. The results suggested that VC firms get large benefits when they have many ties. These benefits increase when a VC is invited to join many syndicates or when they are well connected to other VCs.

    But when VCs act like an intermediary i.e. an agent between two other VCs, there is no significant added value on the fund’s performance.  

    So, in a nutshell, networking is beneficial for VCs when they are taking part in different investments.

    Want to know more about how Kushim facilitates networking among VCs?

    Click here to meet our software venture capital portal.

  • Behold! The new gateway to improve LP-GP relationship has arrived

    Behold! The new gateway to improve LP-GP relationship has arrived

    The number of VC investments has been increasing rapidly over the past decade. And the number of deals as well as the size of investments is increasing along with the number of stakeholders. As a result, with an increased flow of information, the task of tracking the activities of a fund and maintaining LP-GP relationship becomes quite arduous.

    As a VC, how do you stand out and enhance your productivity? The competition among VCs is getting intense. More and more corporates are entering the VC game. Last year more than 260 corporate venture funds invested for the first time.1 Amidst this brewing competition, the hunt to identify the next unicorn is on.

    Let’s say you have identified and invested in the next unicorn. Now you must monitor your investment and report to your Limited Partners (LPs). VCs waste a colossal amount of time preparing LP reports and keeping up with the stringent demands of their LPs. In large firms, even more time is consumed in double checking many documents internally. Using email, as a means of internal communication is the yesteryear way of doing things.

    Edda’s venture capital software Portal is the gateway to optimizing LP reporting, maintaining transparency and improving the LP-GP relationship.

    What does the Portal offer?


    Keeping your LP’s informed dynamically

    Portal’s dashboard features various sections which are crafted in a user-friendly way. The statistics section empowers the LPs to view essential stats such as amount of money invested per month, number of companies in the dealflow, number of companies accepted, rejected and under considerations and much more. Your LPs can have a brief look at the portfolio companies profiles, as well as other companies in the dealflow.  

    The news section of the portal showcases news about the portfolio companies. Keeping in mind customization aspect, Portal allows users to add specific news and announcements for your LPs. For instance, adding relevant articles from other websites takes just a few clicks. In addition, the event section allows you to organize exclusive events and invite your LPs in a completely hassle-free way.

    Now let’s talk about the dreaded monthly reports about your activities which you have to prepare and send to LPs. The Portal gives you the option to automatically email the latest reports to your LPs. Hence you can sit back, let the software venture capital tool do the work, and focus more on finding the next unicorn.

    The power of collaboration and access at your fingertips

    The portal is not just a gateway to provide information to your LPs. In fact, it gives you the power to collaborate not only internally but also externally. Hence taking the LP-GP relationship to another level. You can share relevant documents such as pitch decks, annual presentations or statistical reports with your lawyers, accountants and advisers via the portal.

    There are two access levels for GPs to share dealflow data. The first level is for ambassadors who can see general dealflow statistics and companies under consideration while the second level is for affiliates who are the trusted third parties invited by the ambassadors.

    You can absolutely control the access rights of every individual you collaborate with.

    Sharing and growing

    Many research studies have shown that VCs can improve the performance of their ventures by sharing their dealflow and networking with other VCs. You can share your dealflow with other investors and reap the networking benefits. Since, the portal fetches you with networking benefit, it also helps you find new LPs to raise new funds.

    To solve this problem, Edda built the Portal into its venture capital portfolio management software. The Portal enables LPs  to actively participate in their internal processes by helping them find all the relevant information swiftly and easily. Portal also enhances the communication among the various stakeholders by providing them with a platform to connect and share dealflow.

    Thank you so much for reading. I would love to read your comments and to know more about the Portal you can request a demo by clicking below.

  • Syndicated Deal with CVCs: What is the impact on a startup’s exit value?

    Syndicated Deal with CVCs: What is the impact on a startup’s exit value?

    Our goal in this post is to see what kind of impact can the syndication with CVCs have on a startup’s exit success. The main reason lies in the fact that CVCs investments are increasing year by year.

    In 2018, approximately 260 new corporate venture capital (CVC) funds invested for the first time. This marked a 35% year-over-year increase with Google Ventures maintaining its top spot as the most active CVC investor. GV is followed by Salesforce Ventures and the mammoth Intel Capital occupied the third spot. In 2017, the total capital invested by CVCs was north of $30 billion, which included both old and new CVCs.

    We will base this talk on a recent academic research study by Prof. Shinhyung Kang involving 1121 firms in the United States that received VC funding between 2001-2013. In addition, we will also refer to the prior research by Castellucci and Ertug (2010) which showed that in a syndicate, other investors tend to cater to the needs of the most reputable investors.


    CVCs-IVCs syndication

    The National Venture Capital Association, in 2016, stated that more than 13% of all VC deals in the US were done by CVCs. Generally, CVCs have a strategic objective of making an investment while Independent Venture Capital (IVC) funds have a financial focus. However, it often happens that CVCs and IVCs form a syndicate to share the risk of investment. Basically, syndication means that a number of investors come together with one of them acting as the lead investor. Here, the deal value as one transaction.

    Here it is important to point out that syndication differs from co-investment. Namely, in the latter, two or more investors come together to invest in the same funding round of a venture. In this regard, it is worthwhile to shed some light on the impact of CVCs involvement in syndicates on a venture’s successful exit.

    The impact of investors’ goals on startup’s exit success

    If the CVC has a higher reputation than other investors, the CVC will prompt the venture to pursue more R&D activities that will lower the pace of commercialization. In contrast, as IVCs are focused on financial returns, the higher reputation of IVCs in a syndicate will push the venture to pursue more commercialization activities which will, in turn, lead to a successful exit. Kang’s study affirmed that in a syndicate when CVCs have a higher reputation than IVCs, the likelihood of a venture’s successful exit is negatively affected.

    Geographic distance is another parameter can affect the startup’s exit success. Majority of IVCs and CVCs tend to prefer ventures that are located in close proximity. When a CVC is located in close proximity to a venture, the knowledge sharing between the venture and the CVC’s parent company increases and there is more spending on R&D investments. This, in turn, reduces the venture’s resources which would have been otherwise used to commercialize the venture’s product. Kang’s study concluded that when CVCs are more reputed in a syndicate and are in close geographical proximity to the venture, the likelihood of venture’s successful exit is further impacted negatively to a certain extent.

    Preferences in syndication creation

    For future syndication, CVCs tend to choose those IVCs with whom they have had prior syndication. This is important as the IVCs aid the CVCs in seeking, identifying and attract innovative companies in distant locations. Thus, trust reduces the cost of negotiation and increases communication between the firms participating in the syndicate. IVC investors in a syndicate are quite wary of CVCs tendencies to be more opportunistic. However, when there is strong trust between CVC and IVC, the tendency of CVCs to be opportunistic is lowered as jeopardizing the relationship with co-investors is not in the best interest of the CVC. The final conclusion of Kang’s study stated that prior syndication experience between CVC and IVC reduces the negative impact reputed CVCs have on the likelihood of a venture’s successful exit.  


    Sources

    • Shinhyung Kang, (2019) “The impact of corporate venture capital involvement in syndicates”, Management Decision, Vol. 57 Issue: 1, pp.131-151.
    • The Most Active Corporate VC Firms Globally, CB Insights, Published Mar 28, 2019.
    • Castellucci, F. and Ertug, G. (2010), “What’s in it for them? Advantages of higher-status partners in exchange relationships”, Academy of Management Journal, Vol. 53 No. 1, pp. 149-166.
  • How to build a “good”​ dealflow

    How to build a “good”​ dealflow

    The magic rule of venture capital says that you need to screen 1000 companies to find 2 that are successful. How much time and effort an investor puts in his quest of the Holy Grail? And how much more into creating a proper dealflow?

    A LOT.

    It is simply called Dealflow Management and it’s the second main activity of investors, after fundraising. The dealflow management doesn’t have the best reputation, thus analysts and interns are usually the ones in charge. In fact, their main job is to provide “good dealflow”. In translation this is the equivalent of hours spent doing Excel sheets, powerpoint presentations for the next Partner meeting, writing minutes, updating databases, asking for documents and metrics to companies, preparing reports for management and LPs, etc…

    However, the good news is that most of it can be automated with deal flow management software. In this article we are going to share some tips and tricks on how to improve your current approach to dealflow. If you are new to dealflow management, following these steps will help you manage change and efficiency in your organization.

    Step 1: Think clearly about your process

    In order to do that, think about one company in which you invested that made you proud of how you handled the relationship. Then write down the different stages of evolution and the main activities you performed. For example, these stages can be:

    • new deal source
    • first meeting
    • partner meeting
    • terms and agreement
    • due diligence
    • rejected/invested

    Then work with a software venture capital tool that is flexible enough to support your process. Or a better version of your process.

    Dealflow made easy by Edda

    You always want to learn how other investors manage their dealflow. An easy way to find out is to ask a sales provider of dealflow solutions during the demo “what are the best practices in the industry?/do you have customers in similar organizations, how do they organize their dealflow?”. Good sales people are trained to teach you in order to commit to their solution. If a sales person starts pitching his product before learning about your needs you might be in the wrong place.

    Step 2: Execute your deal origination strategy

    How did you get the best leads in the past?

    The most popular and by far the most powerful strategy for deal origination is the network approach. The best venture capitalists have extensive networks and influence. If you share your knowledge people will appreciate it and will want to share something in exchange. At Edda we work with funds that manage assets between 3M$ and 1.3B$. What makes the difference between a very big fund and a small fund is how they leverage their network to create value. Recently we have created a specific tool for one of our biggest customers in New York. Their initial request was: create more transparency with LPs and ecosystem by sharing data from the dealflow. I will tell you more about that in a future article, I don’t want to disclose too much before the product will be launched later this month.

    Online deal origination should not be neglected. Sources like Crunchbase, Pitchbook, CB Insights or TechCrunch to name just a few are great sources to learn about new trends. Consider also following your influencers on twitter, linkedin and medium. I personally enjoy reading @Fabrice Grinda blog. He shares raw stories from his life and business with a touch of humour. I even borrowed his technique of writing emails to a future self to deal with difficult choices or doubts.

    3) Gather the company data in the same place

    Spreadsheets, dropbox and google drive are still very popular to share and store data. And they are not going to be replaced soon. But for the company data, you might want to have everything in the same place: sources, documents, metrics, emails, track who did what and when, todo’s, comments of the team members, news and articles. If you can’t visualize all this information in a single screenshot, your dealflow is not managed effectively.

    Something else you might want to do at this stage is to share the company data with a trusted source. Since the company data is already organized, the export should be automated.

    4) Measure to improve

    I always say what you cannot measure, you cannot improve. Unless you are a business angel investing your money, you have to stay accountable for your LPs but also your team, companies and network. As an overview of your dealflow, I suggest to track the following:

    • the sources that give you deals
    • the average company time in the different stages of your dealflow
    • the team performance (ratio accepted/rejected for each member)

    5) Skip any activity that is low-value & time-consuming

    If I ask an investor how long it takes to edit an investor note with the profile of a company, I usually get answers varying between 1-6 hours. Usually there is a lack of adrenaline when performing this redundant task. Combined with the procrastinator paradox, the truth is this task can even take several days and analysts are often late delivering it. If the task is really necessary, find out if there is a way to automate it. If not, just skip it.

    Of course digital tools and a clear process are major factors in gaining efficiency and escaping redundant tasks. But maybe the best way to get “good dealflow” is to be a “good investor”. Value your team and value your network. I will end this article with a quote of Paul Graham, the founder of Y Combinator:

     No matter how smart and nice you seem, insiders will be reluctant to send you referrals until you’ve proven yourself by doing a couple investments. Some smart, nice guys turn out to be flaky, high-maintenance investors. But once you prove yourself as a good investor, the deal flow, as they call it, will increase rapidly in both quality and quantity.

    Thank you very much for reading. I would love to hear your thoughts on dealflow management. If you want to learn more about how Edda can help you manage the dealflow, write me a message. I would be happy to chat with you.

    Or you can go ahead and book a demo with me and dig deeper into the possibilities with our dealflow management software.